Summary Report
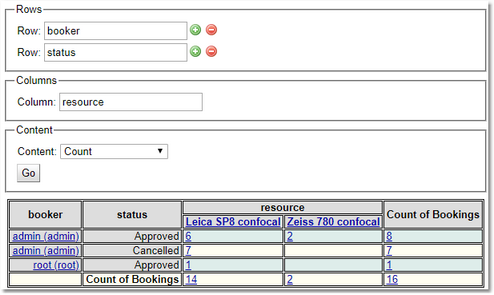
Shows the report as a table, where the user can define the properties that are used for the rows and the columns of the table, and how the content of each cell will be calculated.
When the Summary Report view appears the user will be asked to select the properties that will be used for the rows and for the column. Use the green plus to choose extra rows and the red minus to remove those not required.
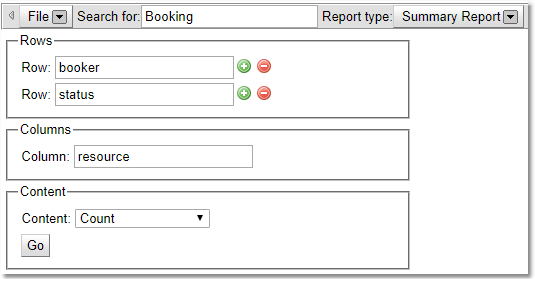
Once the properties have been selected, then select how the content is to be displayed.
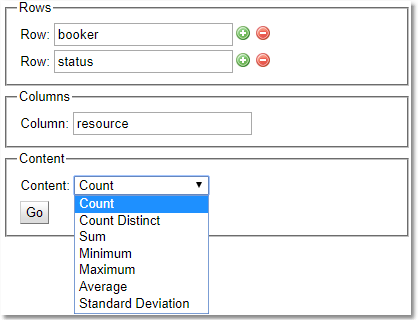
The default content display is count, this will display the content as a simple count of how many records match the row/column combination, with totals for each row and column.
All the other content types require a numerical or date property as an additional parameter (the exception is Count Distinct which will work with any type) . The value of this parameter will be used to determine the value stored in each cell.

Content Type |
Description |
Count Distinct |
How many different values to the property are there for this cell. |
Sum |
The total of this property for this cell (numerical only) |
Minimum |
The smallest value for this property for this cell |
Maximum |
The largest value of this property for this cell |
Average |
The average value of this property for this cell |
Standard Deviation |
The standard deviation of the values of this property for this cell. |
Value At Minimum Of |
Choose a property to find the minimum of, and the value shown in this column will be the value of the current property when the property being compared with is at a minimum. |
Value At Maximum Of |
Choose a property to find the maximum of, and the value shown in this column will be the value of the current property when the property being compared with is at a maximum. |
Below is an example of a table showing the total booking duration in minutes for each project for each resource
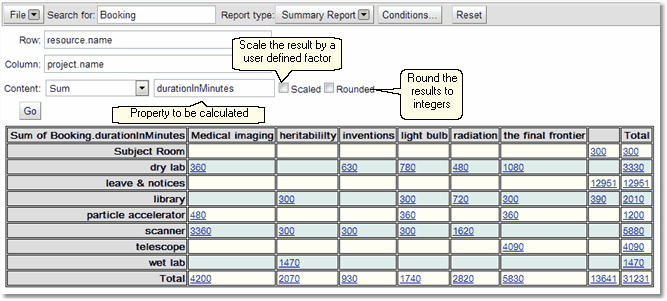
Use the Rounded option to round numbers to integers
Use the Scaled option to scale the results by the user requested factor (i.e if the scaling factor is 10 divides all results by 10).
Viewing Records
Records associated with each cell can be viewed by clicking on the number in the cell. This will give a List Report of the records for that cell beneath the table.
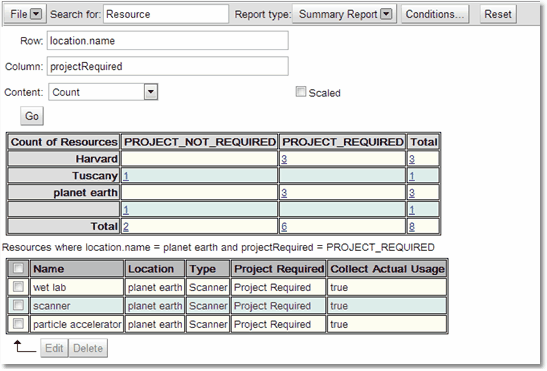
As with the List Report clicking on an individual record will give an expanded view of that record below the list.
If the user has the correct permissions they may edit the individual records or make changes to multiple records. All of this will be covered in the chapter on Editing Search Information

